Filip Hráček / Flutter performance /
Chapter 2: Performance, speed, efficiency
I’m intentionally calling this book “Flutter Performance” even though the term is vague. That’s because, if you care about optimizing apps or games, you’re not looking at one neat metric. You have to have a more complex view.
That said, we can build such a view from smaller parts.
Efficiency
Efficiency is the easiest term to define and measure. Given a problem, the more efficient program simply does less work.
Let’s say you want to find the highest number in a list of numbers. That’s the problem. In practical terms, efficiency is how many CPU instructions you need to execute to get the highest number. The fewer instructions you execute, the more efficient your program.
Here’s an example of ARM64 assembly code for finding a maximum value in an array:
findMax:
        sub     sp, sp, #48    # Allocate 48 bytes on stack
        str     x0, [sp, 8]    # Store array pointer at sp+8
        str     w1, [sp, 4]    # Store array length at sp+4
        str     xzr, [sp, 32]  # Initialize max value to 0
        str     wzr, [sp, 44]  # Initialize loop counter (i) to 0
        b       .L2            # Branch to loop condition

.L5:    # Main loop body
        ldrsw   x0, [sp, 44]   # Load loop counter (sign-extended)
        lsl     x0, x0, 3      # Multiply by 8 (size of double)
        ldr     x1, [sp, 8]    # Load array pointer
        add     x0, x1, x0     # Calculate address of current element
        ldr     d31, [x0]      # Load current element into d31
        str     d31, [sp, 24]  # Store current element on stack
        ldr     d30, [sp, 24]  # Load current element into d30
        ldr     d31, [sp, 32]  # Load current max into d31
        fcmpe   d30, d31       # Compare current with max
        bgt     .L7            # If current > max, branch to L7
        b       .L3            # Else continue to L3

.L7:    # Update maximum value
        ldr     d31, [sp, 24]  # Load current value
        str     d31, [sp, 32]  # Store as new maximum

.L3:    # Increment counter
        ldr     w0, [sp, 44]   # Load counter
        add     w0, w0, 1      # Increment by 1
        str     w0, [sp, 44]   # Store updated counter

.L2:    # Loop condition
        ldr     w1, [sp, 44]   # Load counter
        ldr     w0, [sp, 4]    # Load array length
        cmp     w1, w0         # Compare counter with length
        blt     .L5            # If counter < length, continue loop
        ldr     d31, [sp, 32]  # Load final maximum value
        fmov    d0, d31        # Move to return register d0
        add     sp, sp, 48     # Deallocate stack space
        ret                    # Return
And here’s the same program, but compiled in a higher optimization level. The listing above was compiled with the -O0 flag (default mode). The listing below was compiled with the -O3 flag (a lot more optimizations enabled).
findMax:
        movi    d0, #0              # Initialize max (d0) to 0
        cmp     w1, 0               # Compare array length with 0
        ble     .L1                 # If length <= 0, return
        add     x1, x0, w1, uxtw 3  # Calculate end address

.L3:    # Loop body
        ldr     d31, [x0], 8        # Load double and increment x0 by 8
                                    # Post-indexed addressing mode
        fcmpe   d31, d0             # Compare current value with max
        fcsel   d0, d31, d0, gt     # Select larger value (d31 if d31 > d0)
        cmp     x1, x0              # Compare current pointer with end address
        bne     .L3                 # Continue if not at end

.L1:
        ret                         # Return max value in d0
Even if you've never seen assembly, you can probably tell that the second listing does less work. There are simply fewer instructions. The unoptimized version does a lot of loading (ldr) and storing (str) into memory, and lacks the obvious optimization of skipping the whole function if the list is empty (cmp w1, 0 — is the length zero? ble .L1 — if so, jump to the end of the function).
More efficient code does less work, and therefore draws less energy and improves battery life.
It also generally finishes faster. But not always.
Speed
A program can do less work but still be slower.
One obvious way this happens is when using parallelism. A Dart program can spawn a separate isolate and outsource half of its work to it. By doing so, it will be finished almost twice as fast, but it will also do slightly more work (for example, the work to spawn the extra isolate). Slightly lower efficiency, more complex code, but also much faster execution.
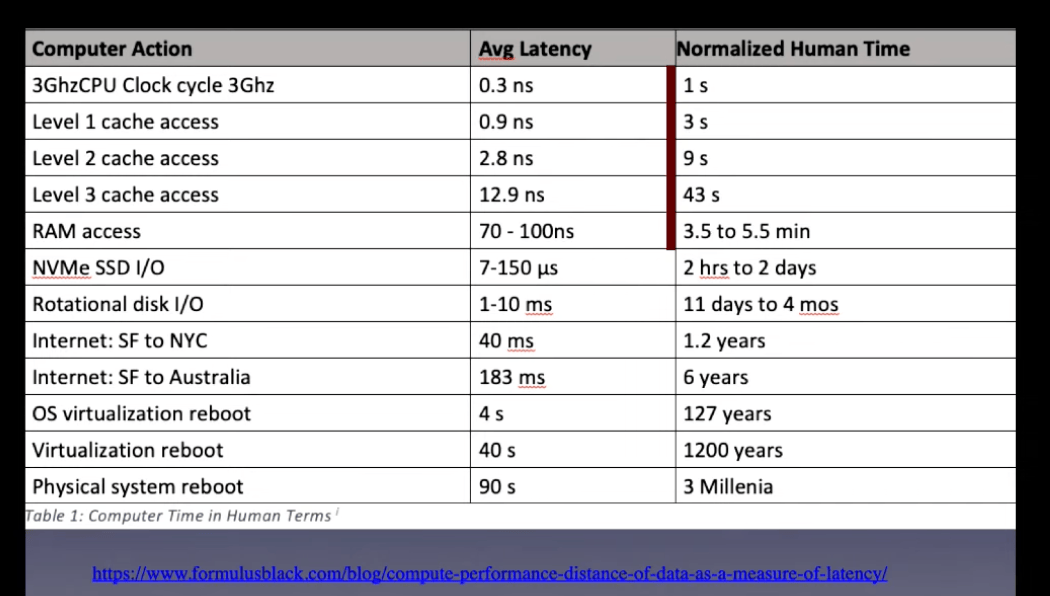
Another reason why efficiency and speed sometime don’t go hand in hand is the fact that not all CPU operations take the same amount of time. A CPU loads a number from memory address x0 to register d31. (That’s ldr d31, [x0] in ARM assembly.) This operation can take something like 1 nanosecond if the address x0 happens to be in Level 1 (L1) cache that sits right next to the CPU. But the same load instruction will take 70-100 nanoseconds if x0 is currently not in one of the L1-L3 caches and must be obtained from RAM. (This is why data locality matters and why we’ll be coming back to this.) So, once again, you can do fewer instructions and therefore have higher efficiency but still be slower.
Now, this is where we might stop if we were building mainframe programs. In the old days — like, way before my time even — the most important programs were batch jobs. Think about something like cracking a military code, where you feed a program with the encoded message and some parameters, and you let it run for minutes or even hours. Same with weather forecast or a ballistic research computer, which runs a physics simulation for a long time before spitting out a result.
These programs needed efficiency and speed, of course, especially since hardware was so slow and expensive back then. What they didn't need was nice user experience.
If you were running a weather forecast simulation in the 1960s, you didn't care how usable or unusable the computer got while it was processing — because the simulation was probably the only program running. You just patiently waited.
Today, though, most computing is different. You expect your pocket computer to update a multi-megapixel screen at least 60 times per second while it’s also decoding an animated gif meme in the background. Most computation comes in very short bursts between frames, not in multi-minute batches.
This is why we also need to talk about jank.
Jank
In computing, “jank” is a word for a perceptible pause in the smooth rendering of an app’s user interface.1 If your app renders at 60 frames per second, and then suddenly freezes for a moment, that’s jank.
Technically speaking, jank isn’t a “bug”, in the traditional sense. The app still works — it just isn’t rendering as smoothly as we’d like it to. But jank can lead to user error, and it definitely leads to frustration and the perception of low quality.
Our tools and our thinking sometimes haven’t caught up to this new reality — but jank is a real problem and we’ll spend a significant part of the book learning how to avoid it. We’re not in the mainframe days anymore.
Perception
Jank is when the app objectively, measurably freezes. But there exists a subtler, less concrete, more “fluffy” kind of performance problem — the user perception of sluggish performance.
I dedicate a whole chapter to this idea but for now, let’s just say that it’s absolutely possible to have a fast, efficient, jank-free app that nevertheless feels sluggish. And it’s also possible to have an app with occasional, well-placed jank that feels snappy and smooth.
Perception, in this case, is everything.
Latency
One way to avoid jank (the objective one) is to give yourself more time per each frame.
For example, Flutter uses pipelining. If you imagine a timeline with evenly spaced ticks for every frame, Flutter allows itself to work on every frame for up to two ticks. While the raster thread is working on one frame, the UI thread can start working on the next one. This utilizes the hardware more efficiently, and it acts as a buffer against the occasional frame that happens to be much more computationally expensive than the others. Such a “misbehaved” frame can essentially take two frames worth of time, and the user still won’t notice.
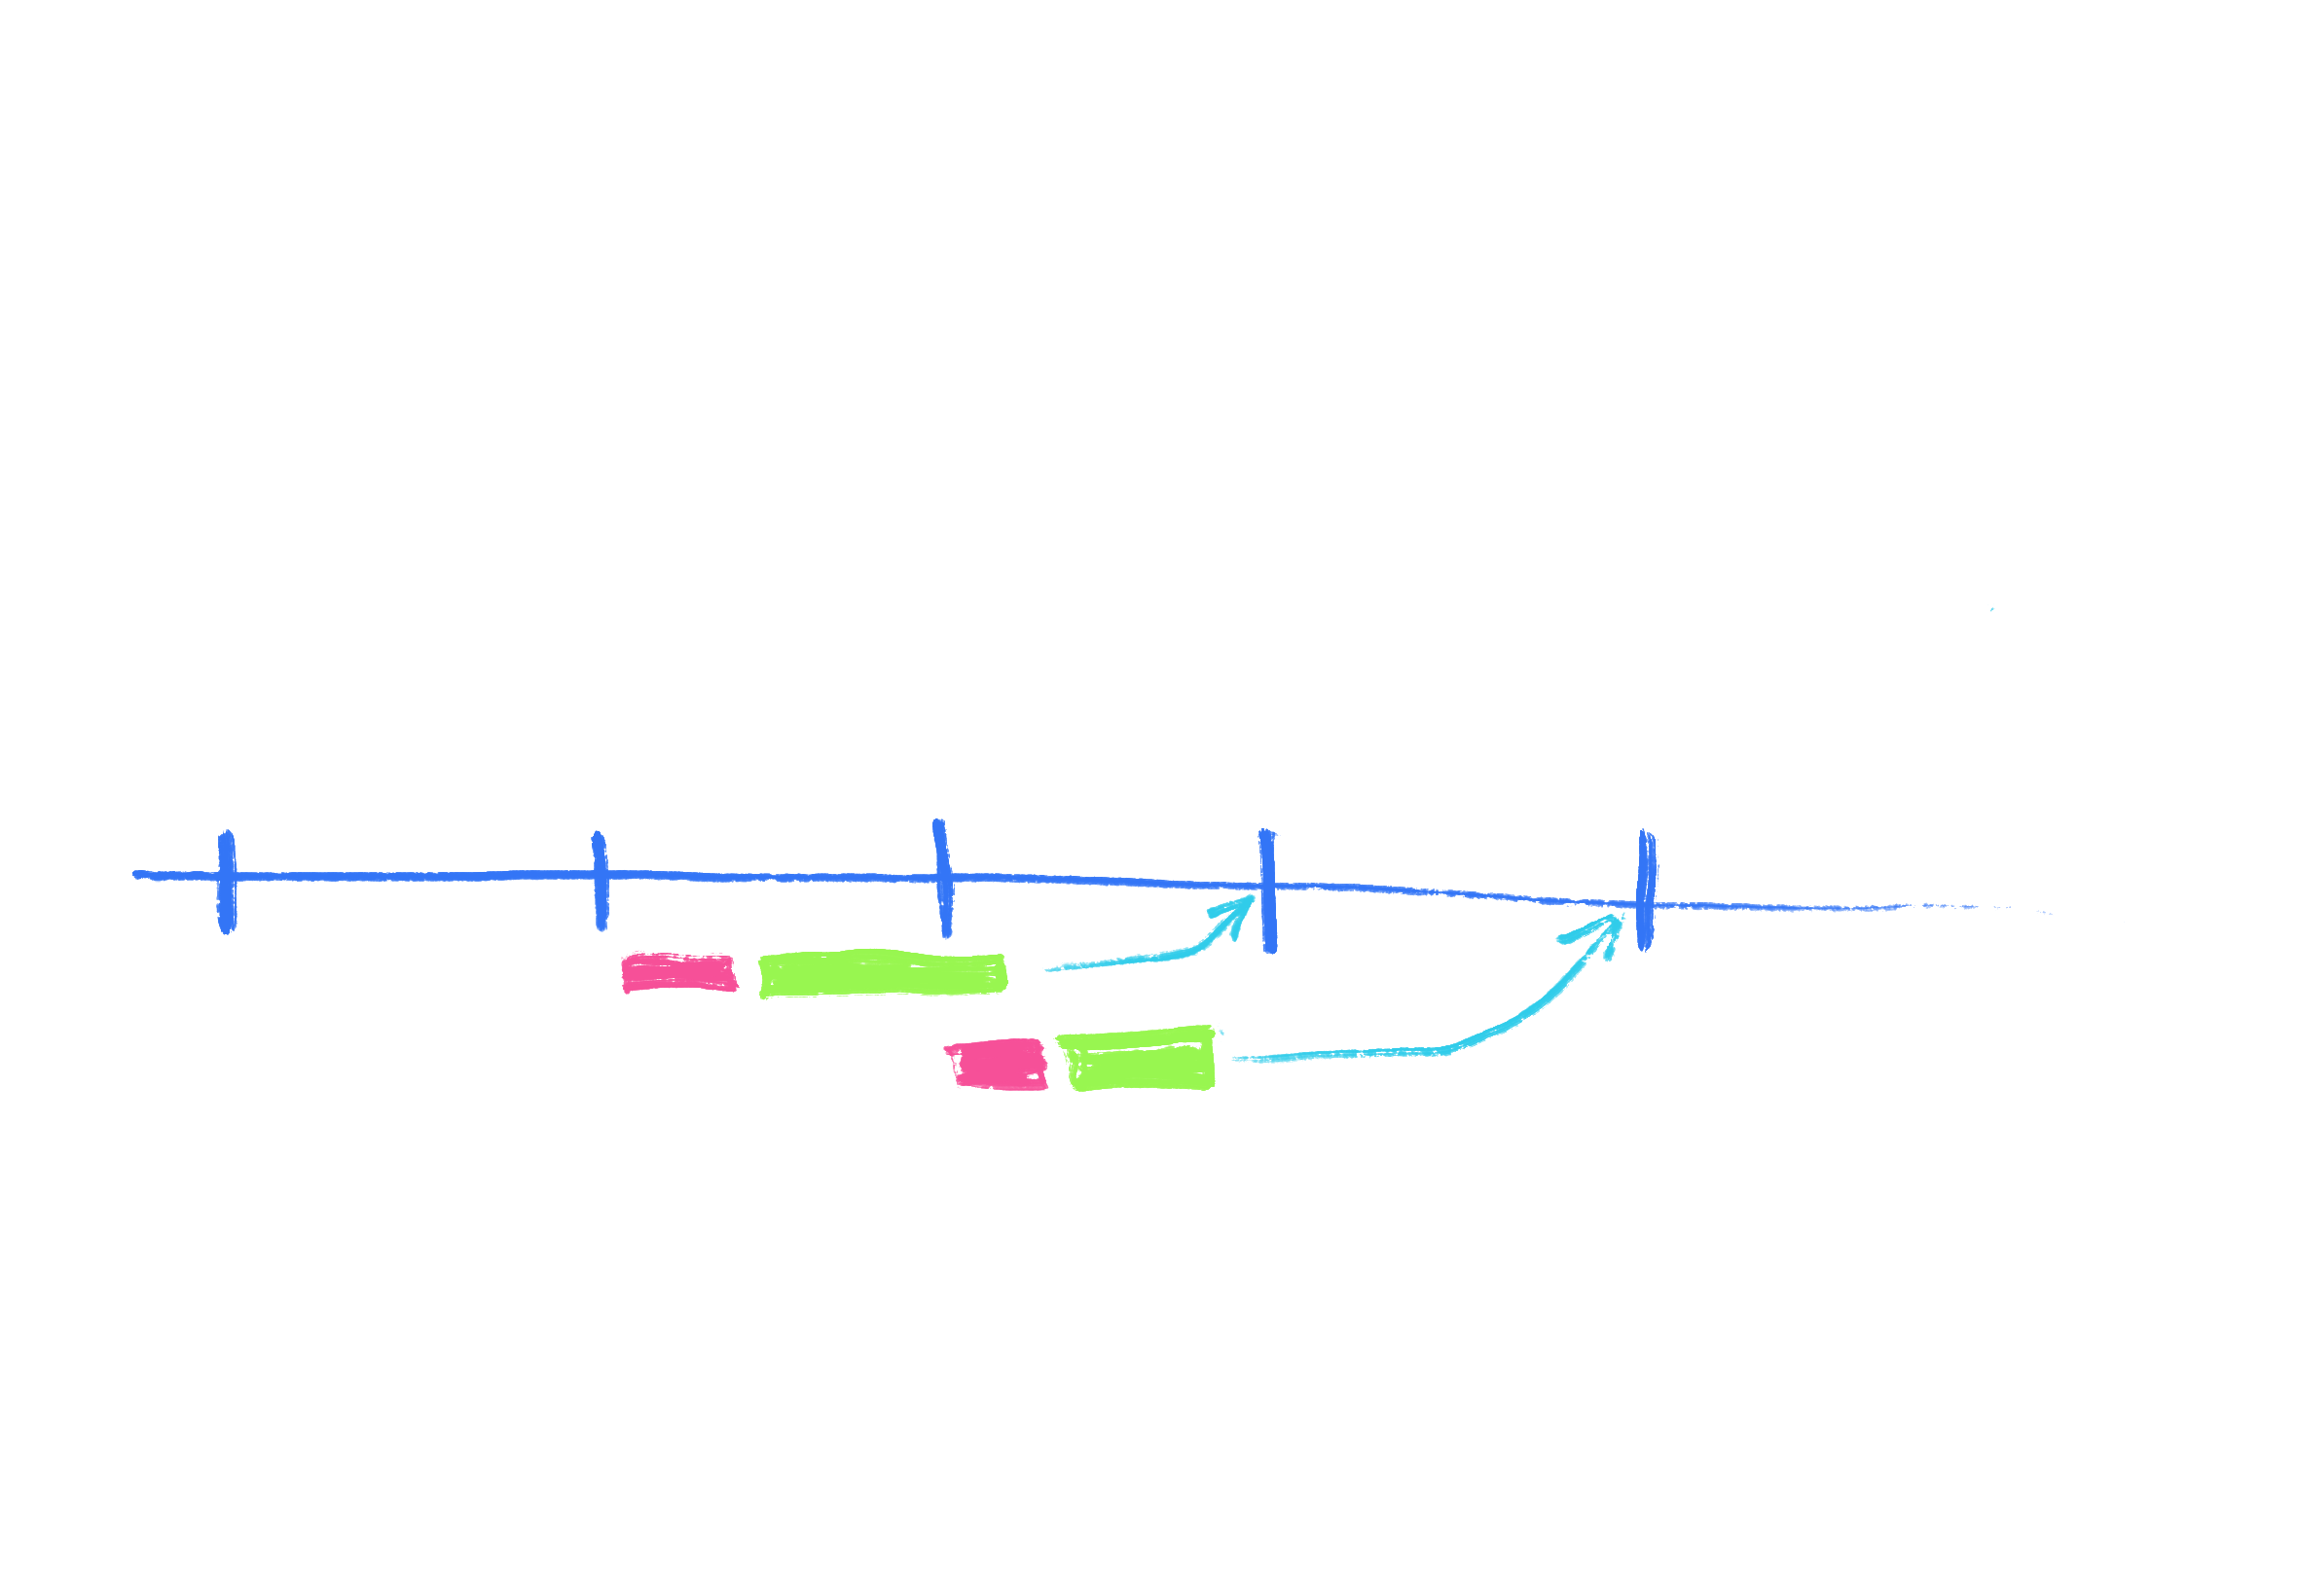
This introduces a frame of latency, though, for every frame.
Latency is the time between the time something should happen, and the time it actually happens. A small amount of latency is okay and pretty much imperceptible. But higher latency can be really frustrating.
It’s good to remember that high latency is something different than jank. You can have a completely smooth app, with no dropped frames, and yet have a high latency: the user clicks a button and the app only reacts after 100ms. That’s bad even if the UI is butter smooth throughout the experience.
Memory consumption
Performance optimization is all about tradeoffs, and one of the more important tradeoffs is the one between “time and space”. That is to say, speed and memory. This is because, in many cases, you can trade one for the other.
To give an example, you can make your $\ln(x)$ (natural logarithm) computation faster by precomputing a table of results in a $x\rightarrow\ln(x)$ map. That approach will let you avoid some CPU cycles — but the table will also consume some space in memory. (You obviously need to be smart about the range and granularity of the precomputed table because — from what I understand — computers with infinite amounts of RAM are in short supply.)
The opposite silly example would be to never cache anything, and always recompute all secondary data from first principles. That would save on memory but it would also make everything extremely slow. Imagine Flutter having to downsize images every frame anew, for example, instead of caching the result.
But memory’s role in performance is more complex than just the time-space tradeoff. When a device runs low on memory, the operating system needs to deal with it, shutting down apps on the background or moving parts of RAM to disk (memory swapping). This makes things slower. Moreover, memory for short-living objects needs to be allocated and then later freed (garbage collected), which is also additional work that can lead to jank.
In extreme cases, too much memory consumption can lead to your app being outright shut down. For example, the Chrome browser has a certain limit to what a single tab can allocate. When the limit is reached, Chrome will simply crash the tab.

So memory is an integral part of performance and it interacts with it in complex ways. We’ll talk about all that in a later chapter.
Performance
Now we can finally get to “performance.” Hopefully, by now you understand that performance is not an easily defined term. It has elements of efficiency in it (which is nicely measurable) but it also encompasses fluffier ideas, such as “acceptable jank” and perception. Performance can be — and often is — in the eye of the beholder.
Some authors have a problem with this. They want an exact definition before they delve deeper. I understand this and, to be honest, only a few short years ago I was one of those people. But these days, I would much rather focus on practical matters than to try to pinpoint an exact definition.
The field of performance optimization is full of exact measurements and precise methodology. Yet the idea of app performance is — in my view — impossible to collapse into well-defined metrics.
There’s a name for our tendency to discount anything that cannot be quantified: McNamara fallacy, named after the US Secretary of Defense during the Vietnam war. The story2 goes that McNamara was trying to come up with a list of aspects to follow the progress of the war. An Air Force general suggested that one such aspect could be the feelings of the Vietnamese people.
McNamara wrote this down, then immediately erased it. “How can anyone get a reading on people’s feelings?” he asked sarcastically. Feelings cannot be measured, and therefore they must not be important.
McNamara’s example might be a bit extreme, but there’s a related phenomenon that you can observe almost everywhere — surrogation. It’s when people begin to believe that a metric is what it attempts to measure:
- Customer satisfaction survey score is customer satisfaction.
- Patient wait times are hospital efficiency.
- Net promoter score is word of mouth.
- Graduation rates are school effectiveness.
- View count is video quality.
- ...
- Lines of code is developer productivity.
- Number of comments is code documentation quality.
- Function length is code complexity.
- Test coverage percentage is code quality.
- Benchmark results are performance.
None of these are true, as I hope everyone realizes.
As unsatisfying as it might feel, I’ll keep the term “performance” vaguely defined by the combination of efficiency, speed, lack of jank, and subjective perception of responsiveness.

Filip worked at Google for 14 years — the last 6 on the Dart and Flutter teams in Mountain View. You may recognize him from some of the educational content from that time. Now he’s based in Prague as an open-source contractor and game developer. He writes Dart code every day.
The text you just read is supposed to be a chapter in Filip’s planned book about Dart and Flutter performance. Get notified when he’s finished.